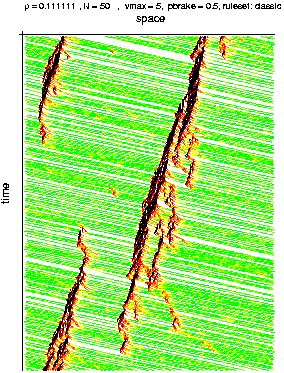
figure 1: CA velocities in a time-space-plot
The development of models for the microscopic simulation of traffic at the Center for Parallel Computing started in 1992 with the doctoral thesis of Kai Nagel, who in cooperation with Michael Schreckenberg implemented simple rules for car following behaviour in a cellular automaton (CA) model.
In order to do fast microscopic traffic simulation we use a very
restricted model of car dynamics. The street is divided into cells of
length
Updating
Rules")?>
We have to specify the CA-rules. They are very roughly based on a more complicated description of car-following dynamics. However, the rules implemented are a kind of caricature of those more complicated descriptions in order to get a desired macroscopic behaviour, and not to mirror the microscopic dynamics as faithful as possible (which seems to be a very hard job, though).
The update rules are modelled according to the following requirements:
In order to achieve this, we have four rules, which are updated in parallel: Let Gap denote the number of empty sites ahead then the state of the system is updated as follows:
The rule 3. makes this model a stochastic CA.
Pbrake is the probability for reducing
the speed by one velocity step compared with the optimal strategy to
drive as fast as possible. Thus on the one hand individual driving
strategies are included and on the other hand the stochastic component
enforces the complex dynamic shown by the model.
An Example")?>
In the time-space-plot (see figure 1) the colors represent the
velocity (rising from black, red, yellow to green). The figure which
shows the velocity-distribution of a roundabout simulation with
several hundred cars in the system is very similar to what can be seen
from an aerial photograph.
This simulation is written in
PostScript. You can run it on your computer if you have a PostScript
viewer such as GhostView. Please
klick here to start the simulation
(PostScript is not very fast). If your are interested in the details
of the PostScript code, you can study the the PostScript file here.
figure 1: CA velocities in a time-space-plot
The migration to the continous limes of the Nagel-Schreckenberg
model is an obvious and finally met in the smooth braking model, developed at the ZAIK by Stefan Krauß.
Summing Up")?>
This very simple model leads to very realistic looking macroscopic results: e.g. the fundamental diagrams of a simulation of the model above looks very similar to the ones, that can be measured with counting devices. An example is shown below, where we have plotted the flow in cars per second as function of car density, which is measured relative to the maximal possible one. This plot shows the typical form: for small flows we have flow increasing with density, while for large flow-values the flow decreases with density until it reaches zero for maximal density. The simulation is done for a two-lane circular road with several thousand cars and varying densities.
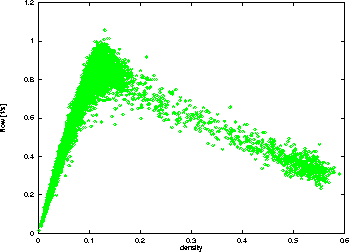
Fundamental diagram of a CA: Several thousand cars drive in a twolane roundabout. You see the traffic flow in dependance of the traffic density.
More traffic")?> For detailled information about our traffic simulation please click: